This is NOT 2008
The threat of a recession is on the minds of investors. Some traditional measures of the yield curve are inverted and, in the past, those have preceded recessions. The link between an inverted yield curve and a recession has so dominated recent financial news that for some investors it’s no longer a matter of whether we get a recession, but how long until it starts.
What these investors are ignoring is how different recent circumstances are from the environment that preceded prior recessions.
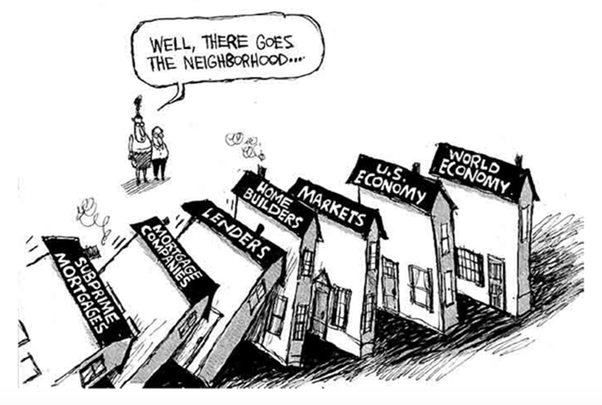
Think about the Panic of 2008. The bubble in home prices in the prior decade pushed national home values more than $6 trillion above “fair value” (based on the normal relationship between home prices and rents). At the time, that over-valuation was the equivalent of about 50% of annual GDP.
The process of unwinding that massive over-valuation happened when bank capital ratios were significantly lower than they are today. And, more importantly, the unwinding happened when banks had to use overly strict mark-to-market accounting standards that required them to value mortgage-related securities at “fire sale” prices regardless of how solid the actual cash flow was on many of these instruments.
Pretty much everyone agrees that housing isn’t grossly overvalued like it was in the years before the Panic. But some think we now have overvaluation in the stock market, so a downdraft in equities will play at least part of the role previously played by real estate, perhaps like back in the 2001 recession.
The problem with this theory is the capitalized profits model we use to assess “fair value” on the stock market says stocks were substantially over-valued at the peak of the first internet boom before the 2001 recession but are still under-valued today.
The price-to-earnings ratio on the S&P 500 peaked at 29.3 in June 1999 (end-of-month, based on trailing 12-month operating earnings). At the end of July 2019, the same ratio was 19.3, more than one-third lower. Meanwhile, the 10-year Treasury yield finished June 1999 at 5.81%. Investors today would kill to get that kind of safe yield, versus the 1.55% we had at Friday’s close. In other words, the stock market is nowhere near the situation it was in about twenty years ago.
Let’s also think about the recessions of 1990-91 and 1981-82, both also preceded by inverted yield curves, but also preceded by a heck of a lot else. Before the stock market crash of 1987, the Federal Reserve had been gradually raising rates. But the October crash temporarily threw the Fed off course, getting it to cut rates, instead. Once it was clear the crash wasn’t the onset of another Great Depression, which some believed at the time, the Fed started raising rates again in early 1988.
By early 1989, the Fed was targeting short-term rates near 10% and the yield curve was inverted all the way out through the 30-year Bond. Unfortunately, the consumer price index was up 5.4% in May 1989 from the year prior. Even “core” prices, which exclude food and energy, was up 4.6%. The Fed was tight but justifiably so, because tight money was the only way to reduce higher inflation. Remember, this was only a decade removed from bouts of double-digit inflation, and so, back then, it was tougher to wrestle higher inflation expectations out of the minds of investors, workers, and consumers.
By contrast, the largest 12-month change in the core CPI since the expansion started is 2.4% and the Fed hasn’t adopted policy tightness to squeeze this out; if anything, with overall CPI inflation now at 1.8%, the Fed has hinted they’d like to see higherinflation.
The same goes for the recession of 1981-82, but even more so. CPI inflation peaked at 14.8% in 1980 and was still hovering above 10% early in President Reagan’s first year in office. So Fed Chairman Paul Volcker jacked up short-term rates to about 19% to smash inflation. By contrast, the 30-year Treasury Bond was yielding about 13%. You want to know what an inverted yield curve looks like? That’s an inverted yield curve.
The bottom line is that yes, the yield curve inverted prior to each of the recessions we discussed, but there were a lot of other things going on, not just the inversion. This time around we search in vain for a housing bubble, low capital ratios among US banks, mark-to-market rules that can turn a downturn into an inferno, a bursting stock market bubble, or a stubborn rise in inflation that the Fed has had to choke off with tight money. Without any of those ingredients, we still believe those predicting a recession in the near term are way too pessimistic.
The only bubble we see right now is in the bond market, with yields way too low given solid economic fundamentals. But, with the Fed unlikely to raise rates, that bubble’s not bursting anytime soon. More likely is a gradual deflating as investors get better returns elsewhere and yields eventually move higher.
To view this article, Click Here
This report was prepared by First Trust Advisors L. P., and reflects the current opinion of the authors. It is based upon sources and data believed to be accurate and reliable. Opinions and forward looking statements expressed are subject to change without notice. This information does not constitute a solicitation or an offer to buy or sell any security.